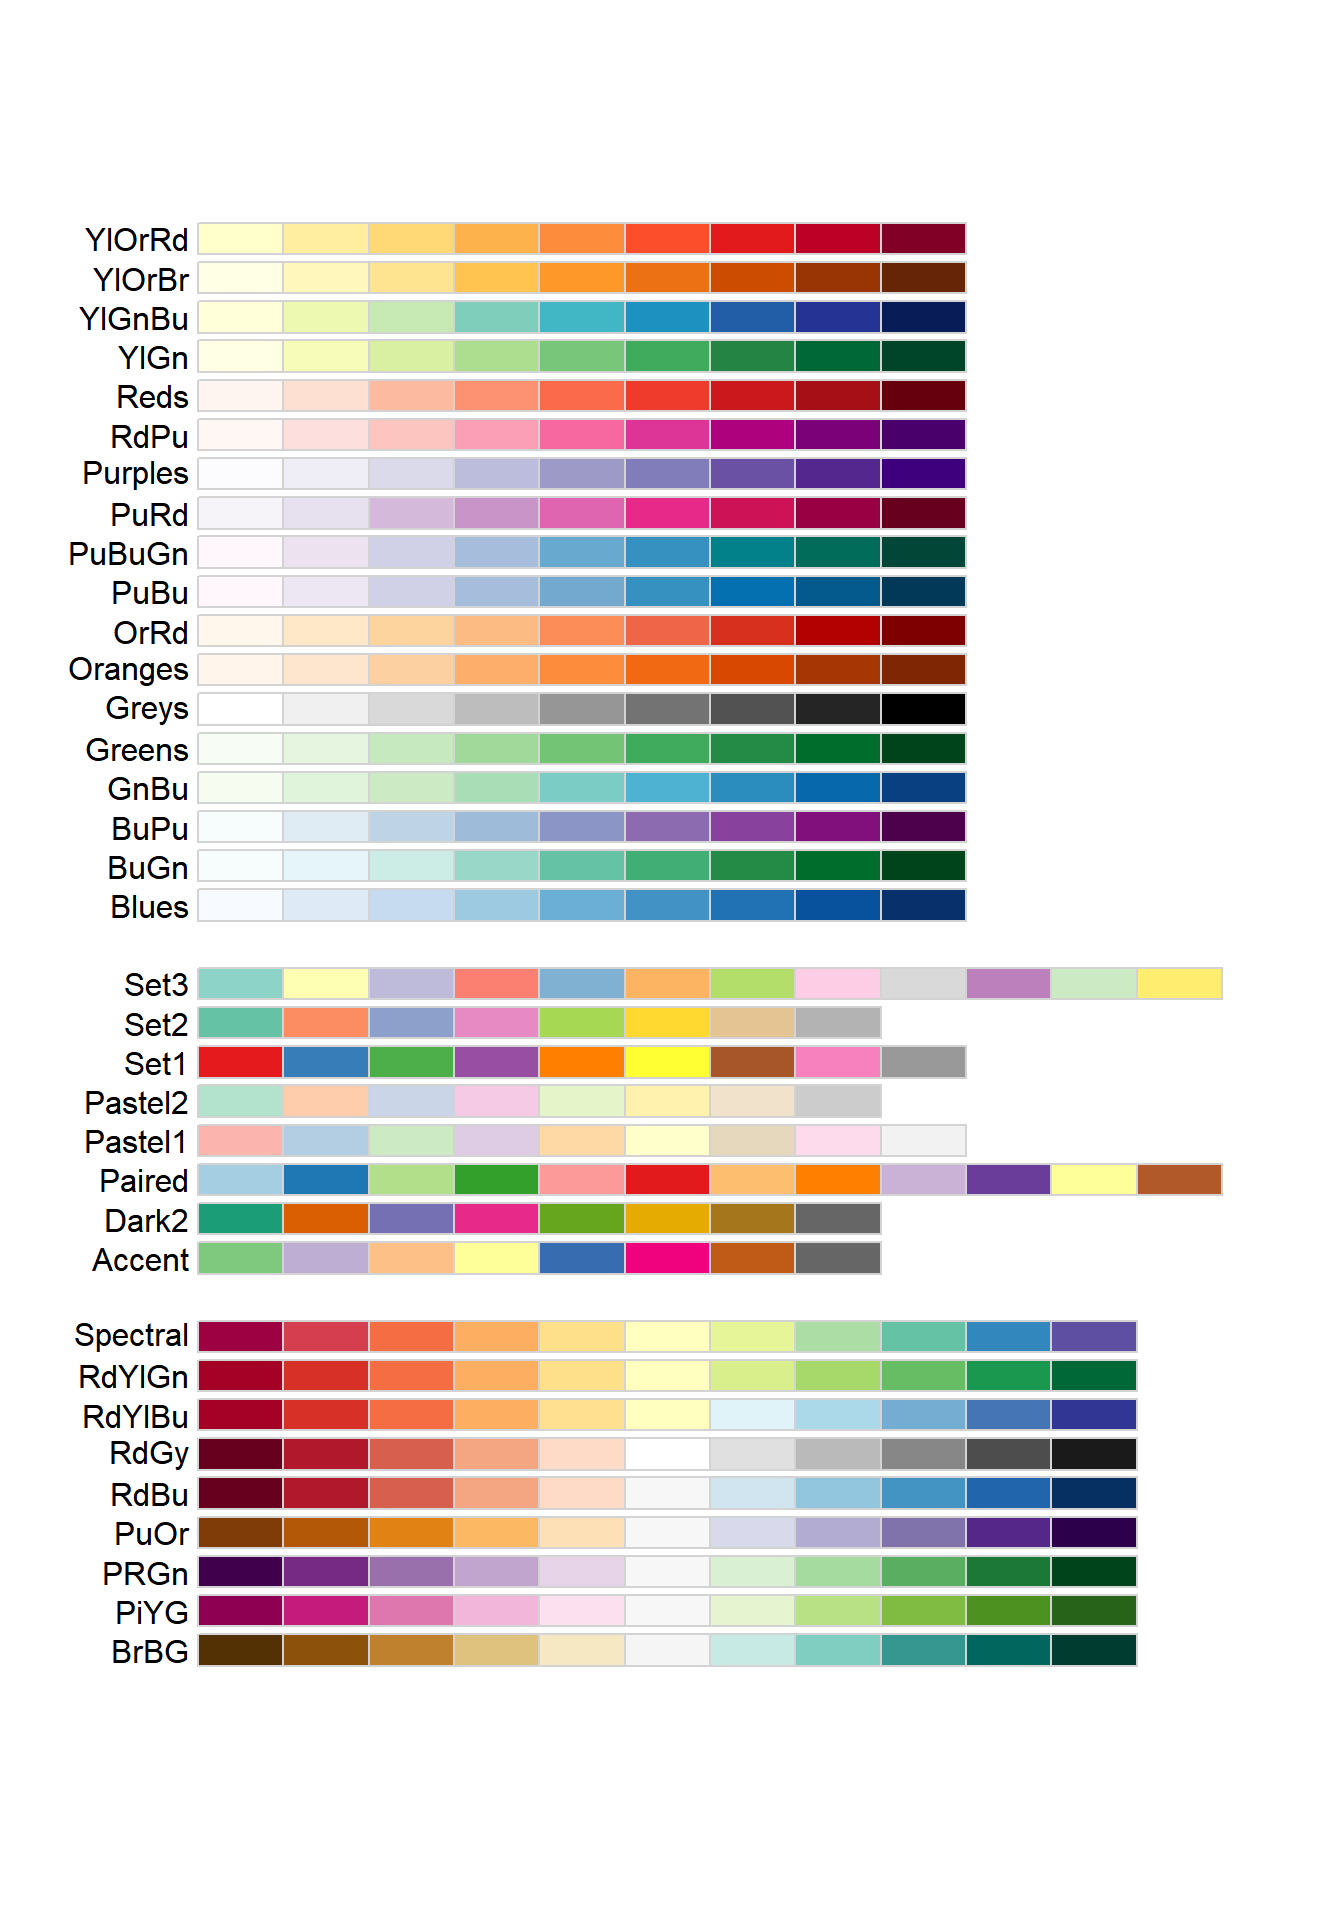
library(RColorBrewer)
display.brewer.all(type = "all")
Lee
October 9, 2023
在科研作图中,配色是一个永远不变的关键,一个简洁、大方、美观的配色方案会让图形增色不少。
在R中,常用的配色包有两个,分别是RColorBrewer和ggsci,它们都可以和ggplot2连用,绘制出配色完美的图形。
RColorBrewer中的所有配色方案library(RColorBrewer)
display.brewer.all(type = "all")
由 图 1 可以看出,RColorBrewer包中的配色方案主要有三种:
可以通过brewer.pal()函数获取指定配色方案的16进制颜色编码,这样我们就可以在之后的绘图中手动挑选自己喜欢的颜色了。
tempColors <- brewer.pal(9, "BuGn") # 获取配色方案的十六进制代码
scales::show_col(tempColors, labels = T)
ggplot2中使用RColorBrewer中的配色方案需要使用scale_fill_brewer()和 scale_color_brewer()。
library(tidyverse)
library(RColorBrewer)

p <- subset(diamonds, carat >= 2.2) |>
  ggplot(aes(x = table, y = price, color = cut)) +
  geom_point(alpha = 0.7) +
  geom_smooth(method = "loess", alpha = 0.5, linewidth = 1, span = 1) +
  theme_bw()

p
p + scale_color_brewer(palette = "Set1")
ggplot2中使用RColorBrewer中的配色方案需要使用scale_**_distiller()函数。
data <- data.frame(
  x = 1:10,
  y = 1:10,
  z = c(1, 2, 3, 4, 5, 6, 7, 8, 9, 10)
)

ggplot(data, aes(x = x, y = y, color = z)) +
  geom_point(size = 5) +
  scale_color_distiller(palette = "Spectral")
包如其名,收录了若干知名的颜色方案。与RColorBrewer不同,ggsci中直接使用scale_**_配色名称()函数调用相关配色。
library(ggsci)
p <- subset(diamonds, carat >= 2.2) |>
  ggplot(aes(x = table, y = price, color = cut)) +
  geom_point(alpha = 0.7) +
  geom_smooth(method = "loess", alpha = 0.5, linewidth = 1, span = 1) +
  theme_bw()

p
p + scale_color_lancet()
vignette("ggsci") # 查看各种配色方案的使用说明。