1 准备
数据包含8807行,每行代表一个电影或电视剧,共有12列。
# 对数据集进行缺失值可视化分析
gg_miss_which(NetFlix)
# 可视化缺失值的集合图
gg_miss_upset(NetFlix)
- director, cast, country, date_added, rating 列包含缺失值。
- director列拥有最多的缺失值。
- director和country列同时缺失的有311行。
- director和cast列同时缺失的有256行。
- director, cast和country同时缺失的行有96个。
- cast和country同时缺失的行有58个。
2 EDA
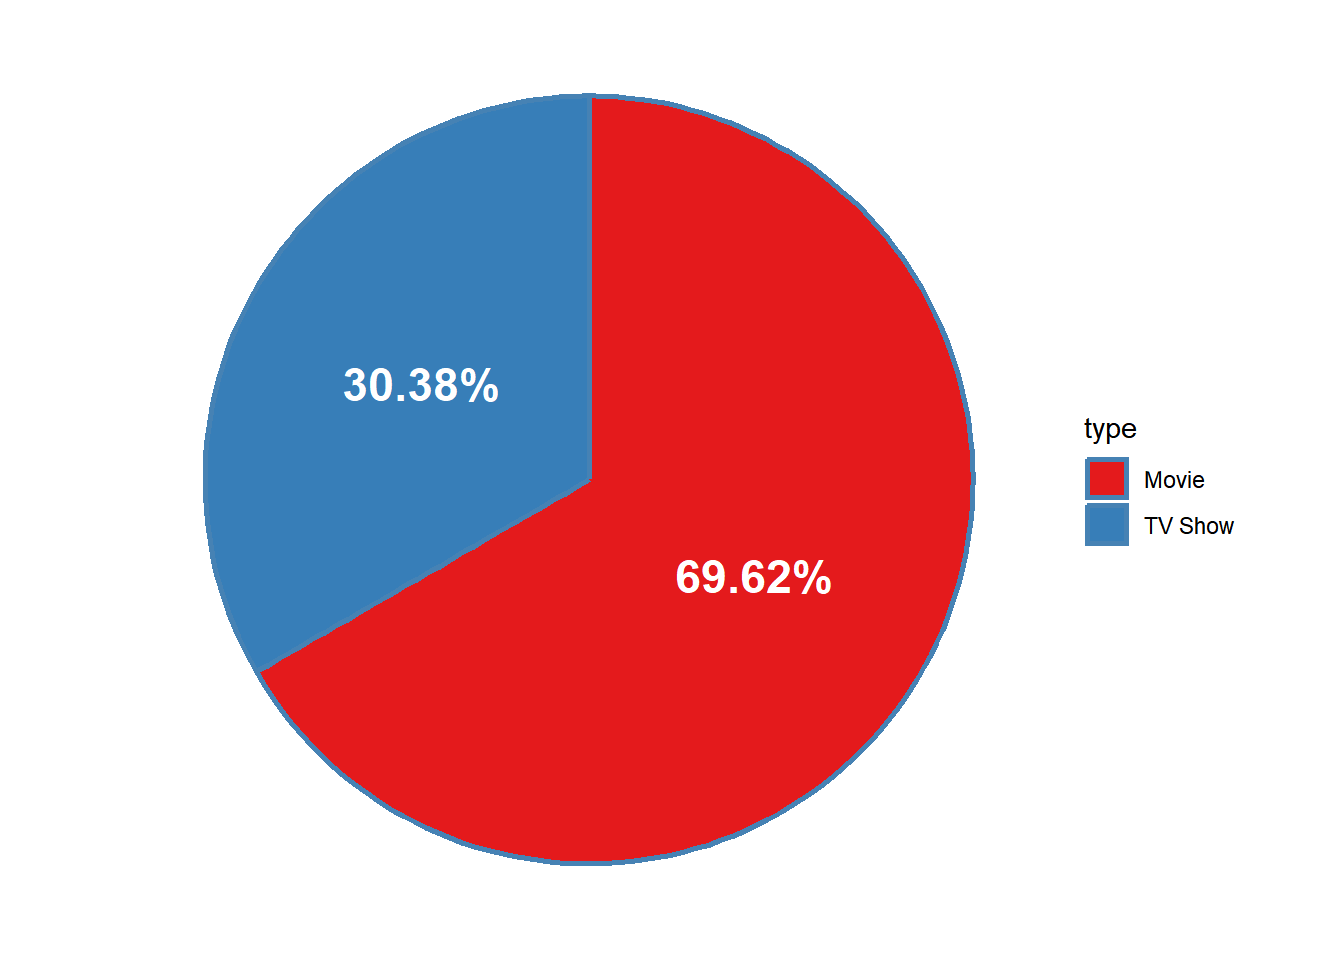
2.1 Netflix拍电影多还是剧集多?
NetFlix |>
  count(type, sort = TRUE) |>
  mutate(prop = paste0(round(n / sum(n) * 100, 2), "%")) |>
  ggplot(aes(x = "", y = prop, fill = type)) +
  geom_bar(
    stat = "identity", width = 0.5,
    color = "steelblue", size = 1
  ) +
  coord_polar("y", start = 0) +
  geom_text(
    aes(y = prop, label = prop),
    position = position_stack(vjust = 0.5),
    size = 6,
    col = "white",
    fontface = "bold"
  ) +
  scale_fill_manual(values = c("#e41a1c", "#377eb8")) +
theme_void()看来网飞还是喜欢拍电影。
2.2 Years Difference between release year and added year!
NetFlix <- NetFlix |>
  mutate(year_diff = year(date_added) - release_year)

NetFlix |>
  count(year_diff, sort = F)
## # A tibble: 76 × 2
##    year_diff     n
##        <dbl> <int>
##  1        -3     1
##  2        -2     1
##  3        -1    12
##  4         0  3241
##  5         1  1585
##  6         2   714
##  7         3   491
##  8         4   367
##  9         5   261
## 10         6   251
## # ℹ 66 more rows
3 不同类型的评级情况
NetFilx_processed <- NetFlix |>
  select(rating, type) |>
  filter(!is.na(rating)) |>
  reframe(across(
    where(is.character), as.factor
  )) |>
  # 等级分组-按照rating的多少划分为5组。
  mutate(rating = fct_lump_n(rating, 5)) |>
  group_by(type, rating) |>
  summarise(Count = n(), .groups = "drop") |>
  arrange(Count)

NetFilx_processed |>
  ggplot(aes(
    x = reorder(rating, -Count),
    y = Count, fill = type
  )) +
  geom_bar(
    stat = "identity", position = "dodge"
  ) +
  scale_fill_manual(values = c("#e41a1c", "#377eb8")) +
  geom_text(aes(label = Count, vjust = 0),
    position = position_dodge(0.9)
  ) +
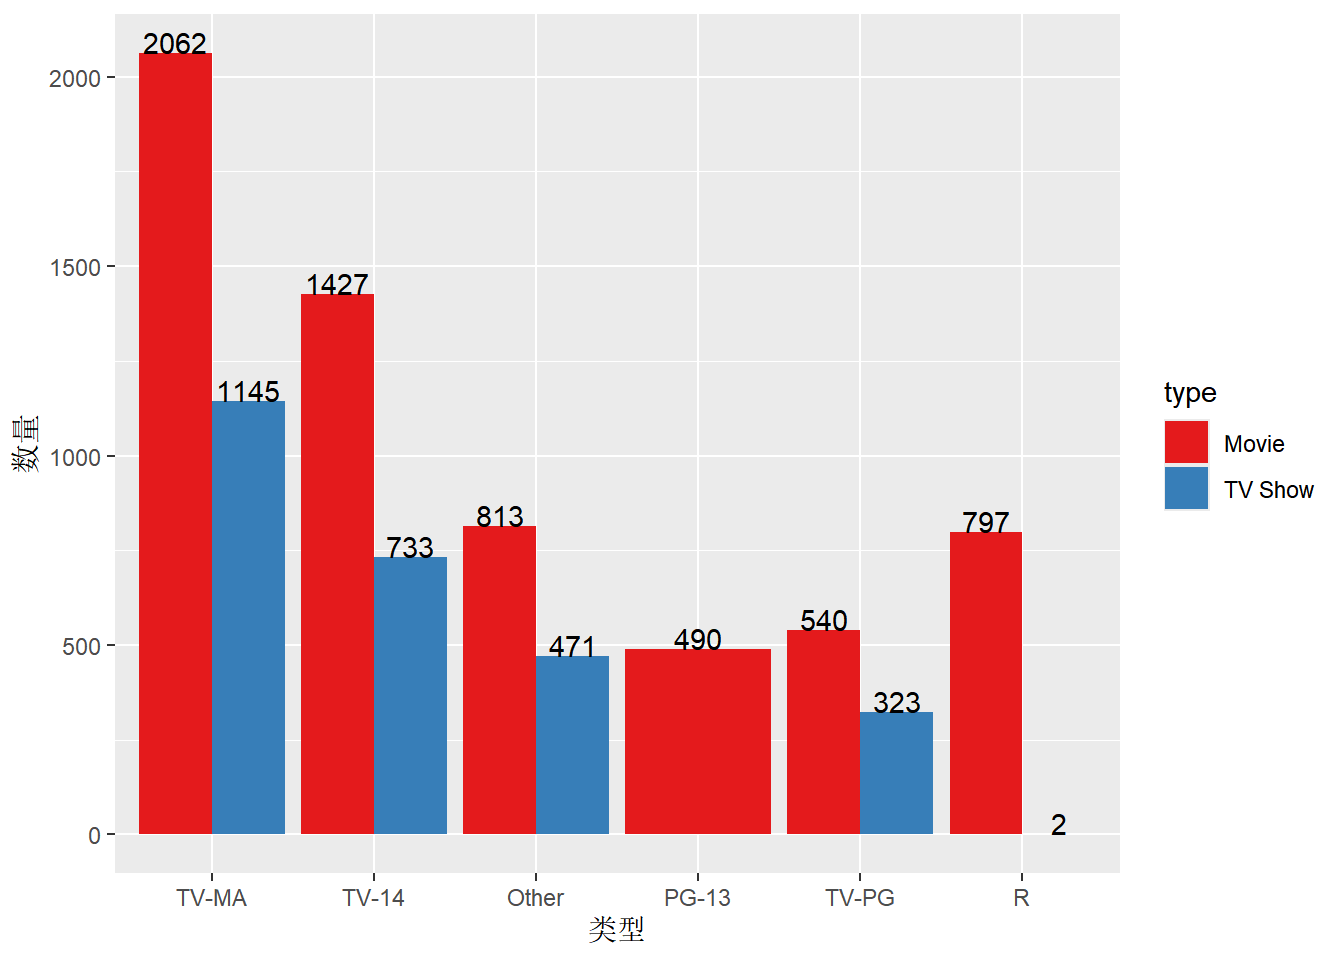
labs(x = "类型", y = "数量")大部分的电影、剧集的评级都在TV-MA,即17岁以上观看。网飞还是很黄暴的。
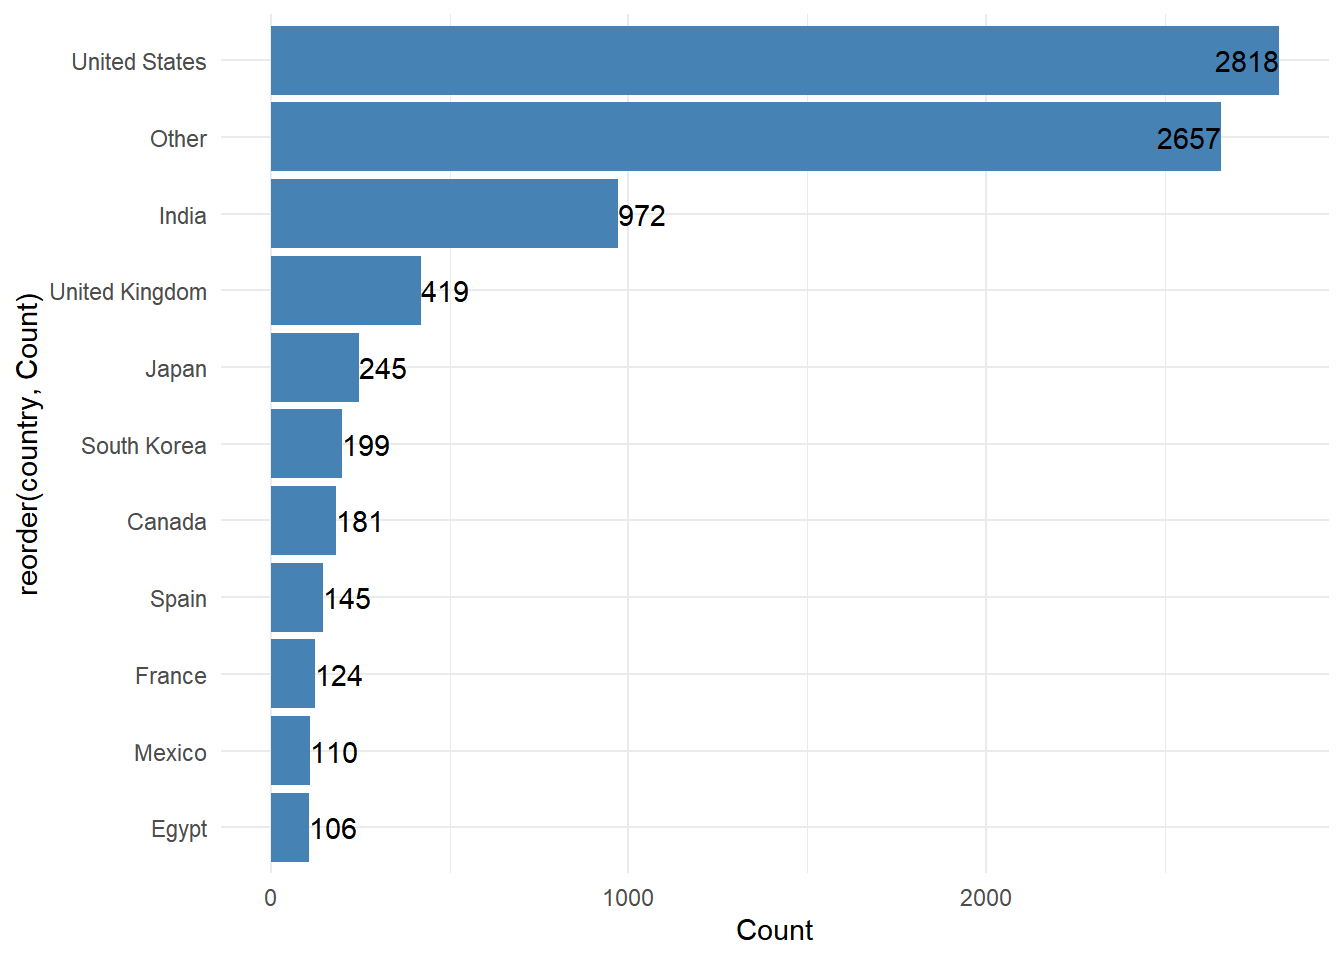
4 国家分布
NetFlix |>
  filter(!is.na(country)) |>
  mutate(country = fct_lump_n(country, 10)) |>
  group_by(country) |>
  summarise(Count = n()) |>
  arrange(Count) |>
  ggplot(aes(x = reorder(country, Count), y = Count)) +
  geom_col(fill = "steelblue") +
  geom_text(aes(label = Count), hjust = "inward") +
  coord_flip() +
  theme_minimal()

