tidyplots

对ggplot2的二次封装

tidyplots
ggplot2
Author

Lee

Published

December 9, 2024

ggplot2是基于图层和映射理念,加之管道 (pipe) 语法的助力,能够逻辑清晰地绘制各种图形.然而,ggplot2也有一些明显的缺点:为了保证其绘图逻辑清晰,即使是很简单的图形也需要较多的代码.

事实上,在多数情况下,尤其是在探索性分析阶段,用户们希望简单敲几个命令就能绘制散点图,直方图,密度函数图等基本图形.只有在正式投稿前,才需要美化图形的细节.

tidyplots便是基于这一理念构建的.默认情况下,它绘制的图形已达到多数人的需求,若需美化,只需附加 add(), remove(), adjust() 三类函数即可.简言之,它的绘图逻辑是:\(基本图形 +「加/减/调」= 新图形\). 正因为如此,同样的图形,tidyplots 的代码量只有 ggplot2 的 1/3 或更少.

1 tidyplots的绘图理念

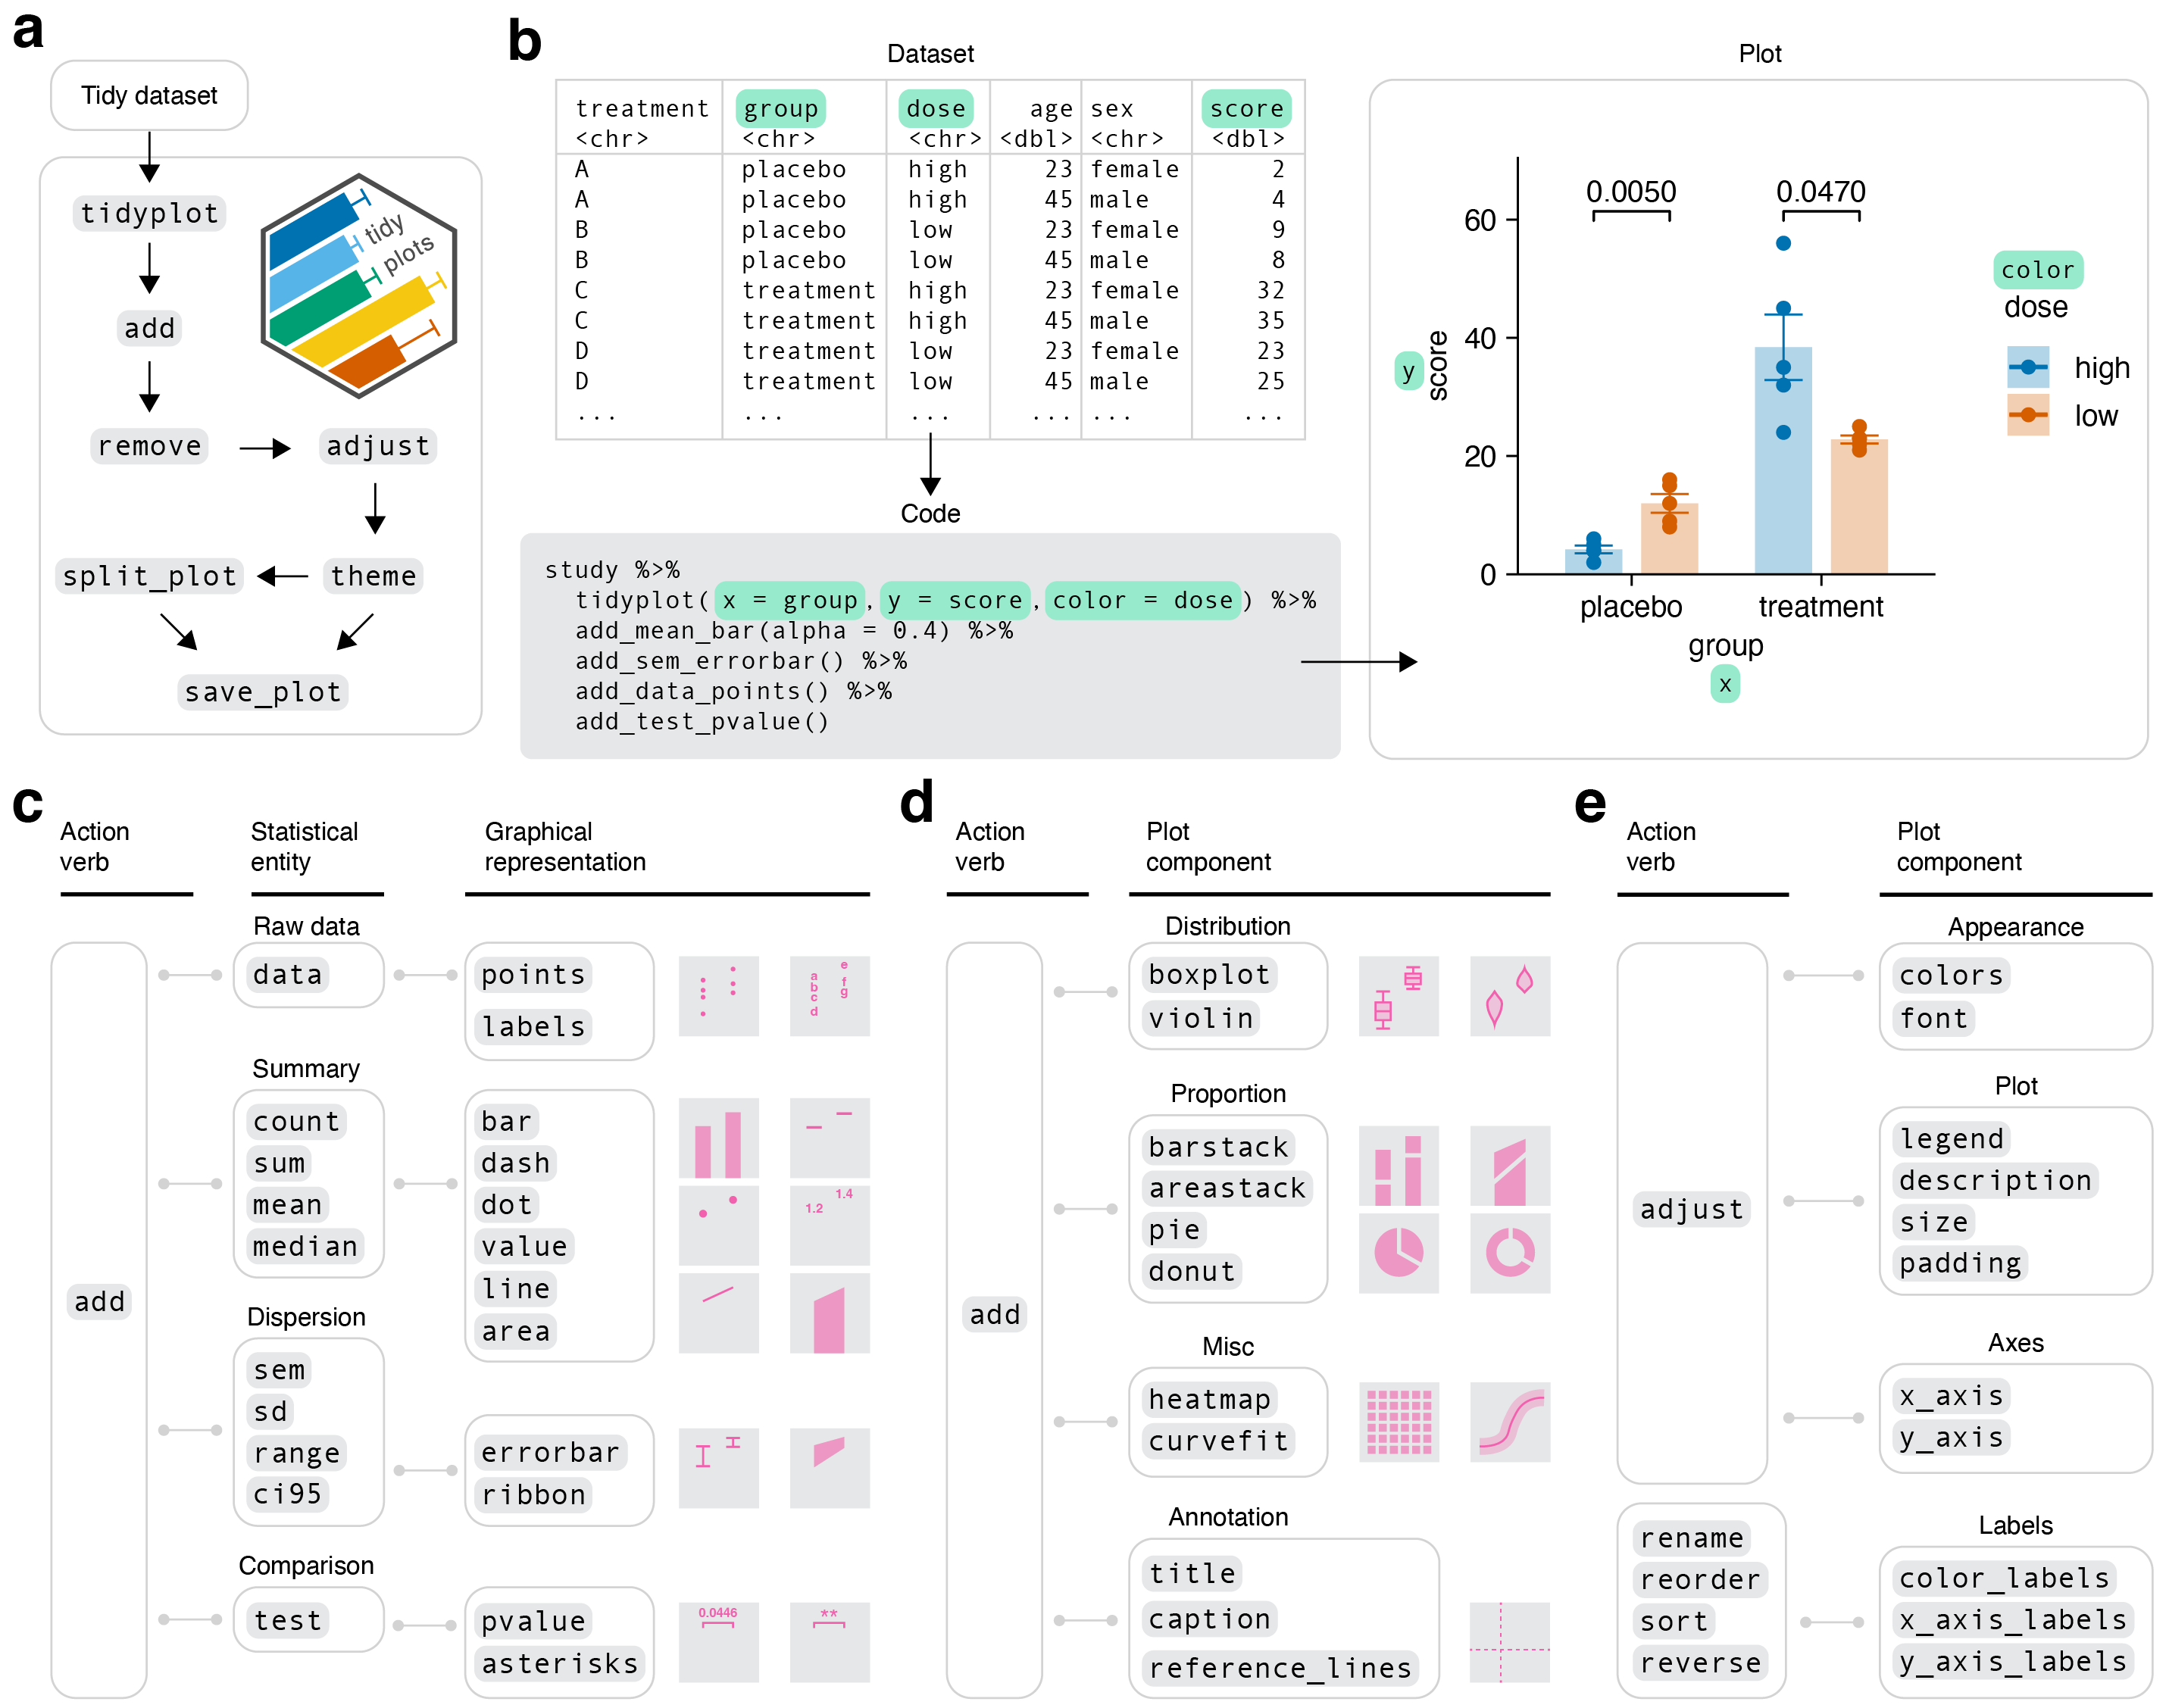
本质上tidyplots是对ggplot2的二次封装,在封装中对ggplot2的绘图进行了一些默认的美化,它的逻辑分为简单的几个步骤(如 图 1 所示):

  1. 通过add(),adjust(),remove()theme()四类核心函数对图形进行修修补补.

  2. tidyplots也提供了split_plot(),view_plot()save_plot()等辅助函数对图形进行切割,预览和保存.

  3. tidyplots中所有的函数索引可参看此链接

图 1: tidyplots绘图流程及主要函数

1.1 add()族函数

add_*()函数用于向图中增加不同的图形元素,其作用类似于geom_***()函数.利用add_*()函数可以轻松的增加数据点,统计图,均值线,误差条等图形元素.

library(tidyverse)
library(tidyplots)

# 对恐龙数据进行可视化分析
dinosaurs %>% 
  # 创建一个以生存时间为横轴的图
  tidyplot(x = time_lived) %>% 
  # 添加一个半透明的计数条形图
  add_count_bar(alpha = 0.4) %>% 
  # 添加计数的虚线
  add_count_dash() %>% 
  # 添加计数的点
  add_count_dot() %>% 
  # 添加计数的数值标签
  add_count_value() %>%  
  # 添加计数的连线图
  add_count_line()

  • 可以看到图形中的x轴还存在严重的重叠现象,我们可以使用adjust_*()函数进行调整.
  • tidyplots默认的图形较小,我们可以通过在tidyplot()函数中将widthheight两项参数定义为NA,将出图的大小变为ggplot2的默认大小.

1.2 adjust_*()族函数

adjust_*()函数用于调整图表元素的外观和样式,例如修改颜色,标题,字体,大小等.这些函数有助于细化图表的样式,使其符合特定的设计需求.

dinosaurs %>% 
  tidyplot(x = time_lived, width = NA, height = NA) %>% 
  add_count_bar(alpha = 0.4) %>% 
  add_count_dash() %>% 
  add_count_dot() %>% 
  add_count_value() %>% 
  add_count_line() %>% 
  # 旋转x轴标签
  adjust_x_axis(rotate_labels = 45) %>% 
  # 调整图形颜色
  adjust_colors(c("black", "white"))

1.3 remove_*()族函数

adjust_*()函数用于移除图标中不需要的部分,例如图例,坐标轴,标题等.这些操作有助于简化图表或突出显示某些部分,使其符合图形的需求.

dinosaurs %>% 
  # 依次添加条形图、线、点、值和连线
  tidyplot(x = time_lived, width = NA, height = NA) %>% 
  add_count_bar(alpha = 0.4) %>% 
  add_count_dash() %>% 
  add_count_dot() %>% 
  add_count_value() %>% 
  add_count_line() %>% 
  # 旋转x轴标签
  adjust_x_axis(rotate_labels = 45) %>% 
  # 调整图形颜色
  adjust_colors(c("black", "white")) %>% 
  # 移除x轴的刻度线
  remove_x_axis_ticks() %>% 
  # 移除x轴的标题
  remove_x_axis_title()

2 顺序修改

tidyplots中,除了调整图表的外观(如标题、颜色等),我们还可以通过一组专用的函数来修改图表中数据标签的名称、顺序、排序和反转.与其他调整函数不同,这些函数的名称以 rename_reorder_sort_reverse_开头.此外,我们可以使用theme_tidyplot(),theme_ggplot2(),theme_minimal_xy(),theme_minimal_x() theme_minimal_y()等函数调用不同主题.

dinosaurs %>% 
  # 依次添加条形图、线、点、值和连线
  tidyplot(x = time_lived, width = NA, height = NA) %>% 
  add_count_bar(alpha = 0.4) %>% 
  add_count_dash() %>% 
  add_count_dot() %>% 
  add_count_value() %>% 
  add_count_line() %>% 
  theme_minimal_xy() %>% 
  # 旋转x轴标签
  adjust_x_axis(rotate_labels = 45) %>% 
  # 调整图形颜色
  adjust_colors(c("black", "white")) %>% 
  # 移除x轴的刻度线
  remove_x_axis_ticks() %>% 
  # 移除x轴的标题
  remove_x_axis_title()

3 tidyplots和ggplot2连用

我们可以再tidyplots代码的基础上添加ggplot2代码,以实现细节的调整.

dinosaurs %>% 
  # 依次添加条形图、线、点、值和连线
  tidyplot(x = time_lived, width = NA, height = NA) %>% 
  add_count_bar(alpha = 0.4) %>% 
  add_count_dash() %>% 
  add_count_dot() %>% 
  add_count_value() %>% 
  add_count_line() %>% 
  # 旋转x轴标签
  adjust_x_axis(rotate_labels = TRUE) %>% 
  # 调整图形颜色
  adjust_colors(c("black", "white")) %>% 
  theme_ggplot2() %>% 
  add(ggplot2::theme(axis.text.x = ggplot2::element_text(
    size = 7, color = "red", angle = 45, hjust = 1, vjust = 1
  ))) %>% 
  # 移除x轴的刻度线
  remove_x_axis_ticks() %>% 
  # 移除x轴的标题
  remove_x_axis_title()

4 示例

我们通过一个完整的例子来看看tidyplots包的作图逻辑和思路。

tidyplots的配色方案

tidyplots的函数列表

tidyplots::study %>% 
  tidyplot(
    x = treatment, y = score, color = treatment,
    width = NA, height = NA) %>%   # 创建绘图空间
  add_data_points() %>%  # 根据源数据,增加散点
  add_mean_bar(alpha = 0.4) %>%  # 将各组数据的平均值绘制柱形图
  add_sem_errorbar() %>%  # 绘制误差线,sem为standard error of mean.
  adjust_title("This is my fantastic plot title") %>%  # 添加图形标题
  adjust_x_axis_title("Trearment group") %>% 
  adjust_y_axis_title("Disease score") %>% 
  adjust_legend_title() %>%
  adjust_colors(new_colors = colors_discrete_seaside) %>% 
  rename_x_axis_labels(
    new_names = c(
      "A" = "a",
      "B" = "b",
      "C" = "c",
      "D" = "d"
    )
  ) %>% 
  sort_x_axis_labels() %>% 
  reverse_x_axis_labels() %>% 
  theme_tidyplot(fontsize = 15)