# 作图
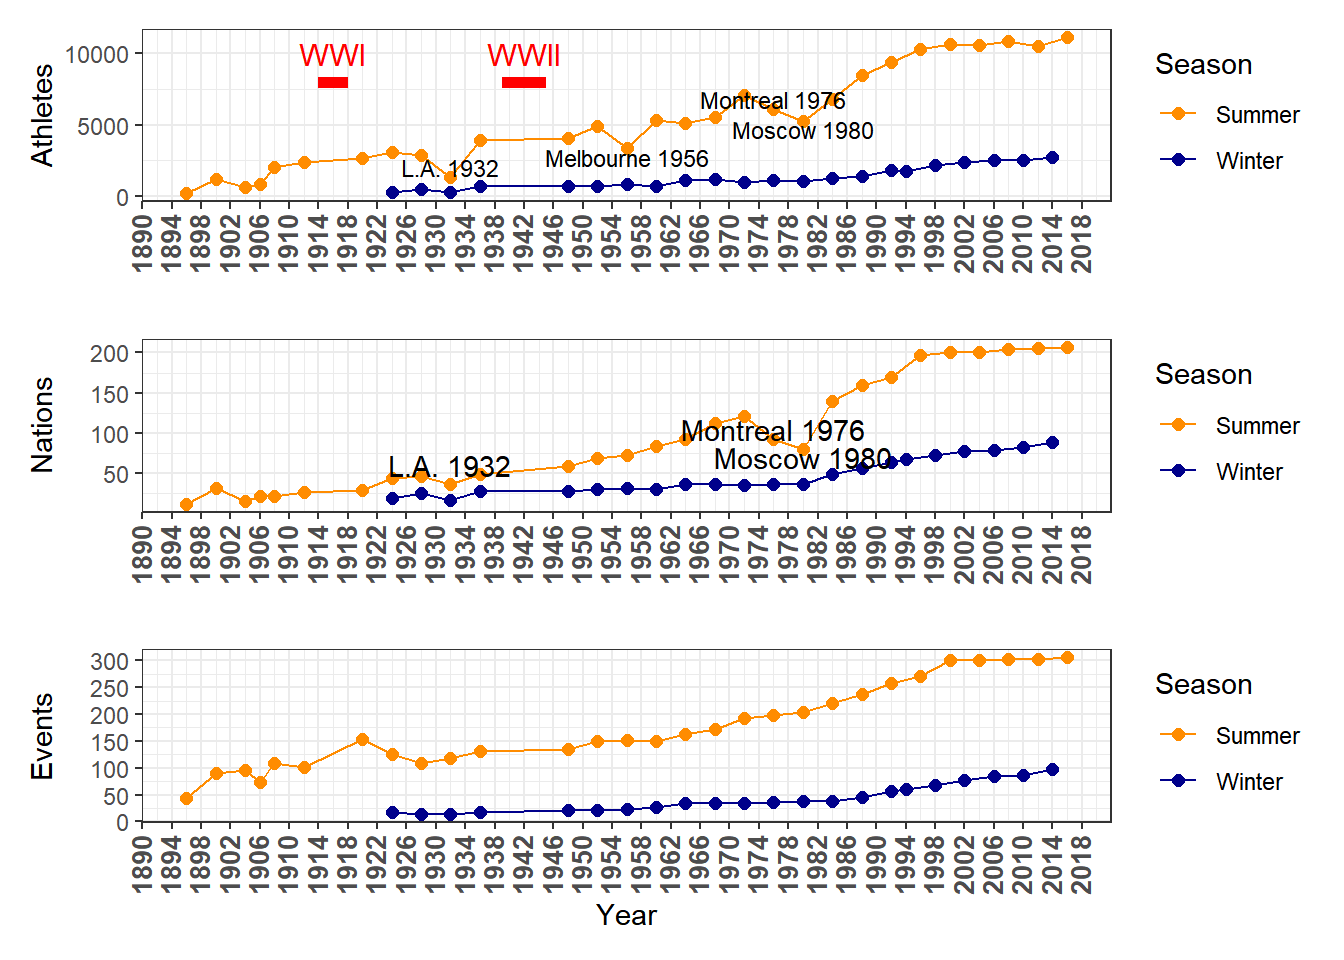
# 运动员数量及关键时间点
p1 <- ggplot(counts, aes(x = Year, y = Athletes,
group = Season, color = Season)) +
geom_point(size = 2) +
geom_line() +
scale_color_manual(values = c("darkorange", "darkblue")) + # 手动设置图形颜色
xlab(" ") +
annotate("text", x = c(1932, 1956, 1976, 1980),
y = c(2000, 2750, 6800, 4700),
label = c(
"L.A. 1932",
"Melbourne 1956",
"Montreal 1976",
"Moscow 1980"),
size=3) + # 对几个临界拐点进行标记。
# 针对两次世界大战的时间做出标记
annotate("text", x = c(1916,1942), y = c(10000,10000),
label = c("WWI", "WWII"),
size = 4, color = "red") +
geom_segment(aes(x = 1914, y = 8000, xend = 1918, yend = 8000),
color = "red", size = 2) +
geom_segment(aes(x = 1939,y = 8000, xend = 1945, yend = 8000),
color = "red", size=2) +
scale_x_continuous(breaks = seq(1890, 2020, 4)) +
scale_y_continuous(breaks = seq(0, 15000, 5000)) +
theme_bw() +
theme(axis.text.x = element_text(size = 10, angle = 90, vjust = 0.4, face = "bold"))
# 参与国家数量及关键时间点
p2 <- ggplot(counts, aes(x = Year, y = Nations,
group = Season, color = Season)) +
geom_point(size = 2) +
geom_line() +
scale_color_manual(values = c("darkorange", "darkblue")) +
xlab("") +
annotate("text", x = c(1932, 1976, 1980),
y = c(60, 105, 70),
label = c("L.A. 1932",
"Montreal 1976",
"Moscow 1980")) +
scale_x_continuous(breaks = seq(1890, 2020, 4)) +
scale_y_continuous(breaks = seq(0, 250, 50)) +
theme_bw() +
theme(axis.text.x = element_text(size = 10, angle = 90, vjust = 0.4, face = "bold"))
# 参赛项目
p3 <- ggplot(counts, aes(x = Year, y = Events, group = Season, color = Season)) +
geom_point(size = 2) +
geom_line() +
scale_color_manual(values = c("darkorange", "darkblue")) +
scale_x_continuous(breaks = seq(1890, 2020, 4)) +
scale_y_continuous(breaks = seq(0, 350, 50)) +
theme_bw() +
theme(axis.text.x = element_text(size = 10, angle = 90, vjust = 0.4, face = "bold"))
p1 / p2 / p3